Back
Back
How to Analyze Competitor Ads (Without the Screenshot Grind)
How to Analyze Competitor Ads (Without the Screenshot Grind)

Table of Contents
49% of sales lift driven by creative (Nielsen) | 1.69x celebrity-on-camera lift, in 7% of posts | 0.82x humor lift, the category's most common angle | 3,804 posts read on one platform |
Most competitor ad analysis answers the wrong question. Counting how many ads a rival runs tells you what they publish, but it does not tell you which creative elements move engagement. Those two answers are often opposite: the element a category uses most can be the one that performs worst.
Nielsen and NCSolutions put creative at roughly 49 percent of a campaign's sales lift, the single largest factor by a wide margin (Nielsen via MarketingCharts, 2024). If creative drives that much of the result, reading competitor creative well is most of the analysis job.
Here is how to do it without opening the Meta Ad Library on a Monday morning and screenshotting for an hour.
49% of sales lift driven by creative (Nielsen) | 1.69x celebrity-on-camera lift, in 7% of posts | 0.82x humor lift, the category's most common angle | 3,804 posts read on one platform |
Most competitor ad analysis answers the wrong question. Counting how many ads a rival runs tells you what they publish, but it does not tell you which creative elements move engagement. Those two answers are often opposite: the element a category uses most can be the one that performs worst.
Nielsen and NCSolutions put creative at roughly 49 percent of a campaign's sales lift, the single largest factor by a wide margin (Nielsen via MarketingCharts, 2024). If creative drives that much of the result, reading competitor creative well is most of the analysis job.
Here is how to do it without opening the Meta Ad Library on a Monday morning and screenshotting for an hour.
Key takeaways
Key takeaways
Counting what rivals run tells you usage.
What decides results is lift, meaning how much an element raises engagement on its own.
The most-used element and the highest-lift element are often different.
Sort every element into Levers (high lift, low usage), Drags (low lift, high usage), and Table stakes (average lift, high usage).
Spend your testing budget on the levers.
Compare each competitor against the category norm to find the lever it owns and the lever it is leaving unused.
Counting what rivals run tells you usage.
What decides results is lift, meaning how much an element raises engagement on its own.
The most-used element and the highest-lift element are often different.
Sort every element into Levers (high lift, low usage), Drags (low lift, high usage), and Table stakes (average lift, high usage).
Spend your testing budget on the levers.
Compare each competitor against the category norm to find the lever it owns and the lever it is leaving unused.
Usage versus lift: what competitor ad numbers can and cannot tell you
Usage versus lift: what competitor ad numbers can and cannot tell you
Two measurements look similar and mean very different things. Usage is how often a creative element shows up. Lift is how much that element raises engagement once you hold everything else constant. A creative angle can appear in most ads and still be a drag, because how often something is used and how well it works are separate facts.
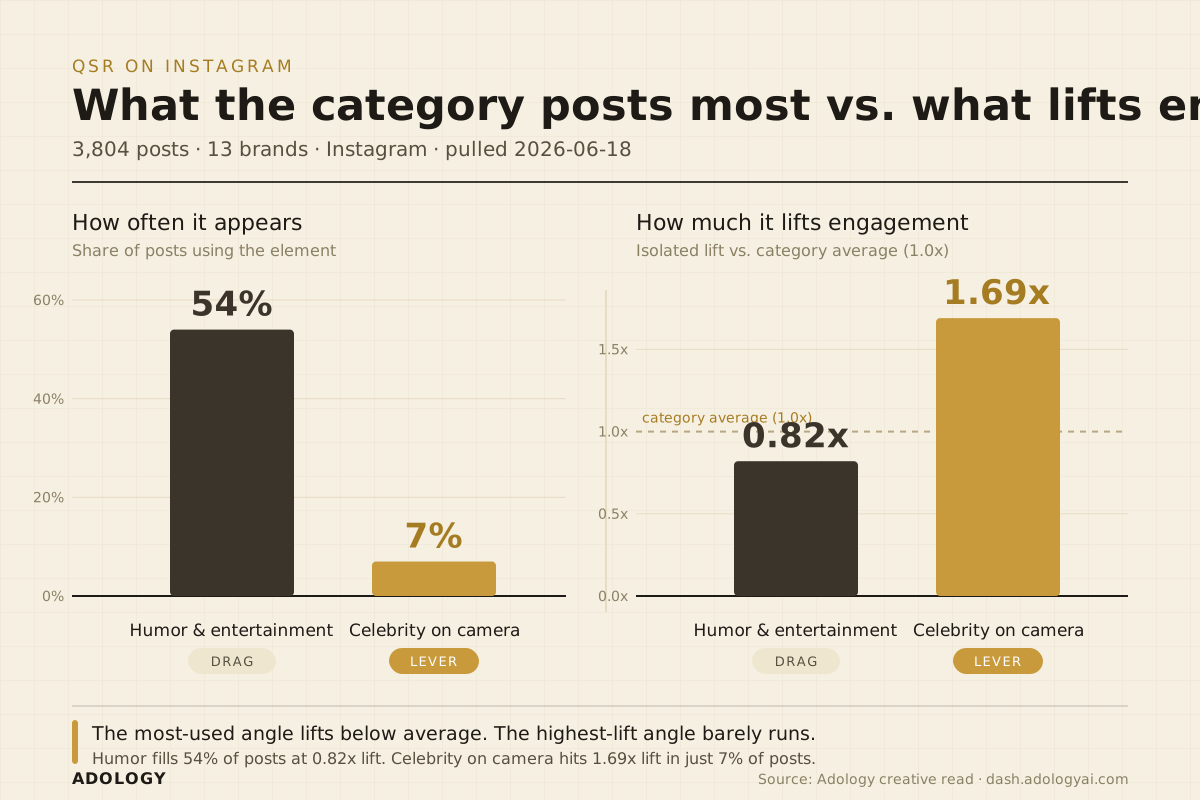
A quick-service restaurant example on Instagram makes the gap clear. Across 3,804 posts from 13 brands, humor and entertainment is the category's favorite angle, present in 54 percent of posts. Its isolated lift is 0.82x, below the category average. Putting a celebrity or recognizable public figure on camera carries a 1.69x lift, well above average, and appears in only 7 percent of posts.
The most-used angle is a mild drag, and the highest-lift angle is nearly absent. A team that only counted ads would copy the humor and miss the celebrity lever.
Two measurements look similar and mean very different things. Usage is how often a creative element shows up. Lift is how much that element raises engagement once you hold everything else constant. A creative angle can appear in most ads and still be a drag, because how often something is used and how well it works are separate facts.
A quick-service restaurant example on Instagram makes the gap clear. Across 3,804 posts from 13 brands, humor and entertainment is the category's favorite angle, present in 54 percent of posts. Its isolated lift is 0.82x, below the category average. Putting a celebrity or recognizable public figure on camera carries a 1.69x lift, well above average, and appears in only 7 percent of posts.
The most-used angle is a mild drag, and the highest-lift angle is nearly absent. A team that only counted ads would copy the humor and miss the celebrity lever.
The Lever-Drag read: sorting competitor creative into three buckets
The Lever-Drag read: sorting competitor creative into three buckets
Once you can tell usage from lift, sorting a competitor's creative is fast. Put every element you can label into one of three buckets.
Levers are high lift and low usage. Levers are underpriced attention and the first place to run your own tests.
Drags are low lift and high usage. Drags are the crowded default that everyone copies. Cut or rethink these before adding more.
Table stakes are average lift and high usage. Keep table stakes, but they do not belong on a strategy slide.
In the QSR Instagram set, celebrity presence and a clean square format sit in the lever bucket. Humor and a generic platform-native look sit in the drag bucket. The goal is to move your testing budget out of the drags and into the levers.
Once you can tell usage from lift, sorting a competitor's creative is fast. Put every element you can label into one of three buckets.
Levers are high lift and low usage. Levers are underpriced attention and the first place to run your own tests.
Drags are low lift and high usage. Drags are the crowded default that everyone copies. Cut or rethink these before adding more.
Table stakes are average lift and high usage. Keep table stakes, but they do not belong on a strategy slide.
In the QSR Instagram set, celebrity presence and a clean square format sit in the lever bucket. Humor and a generic platform-native look sit in the drag bucket. The goal is to move your testing budget out of the drags and into the levers.
How to read one competitor against the category norm
How to read one competitor against the category norm
A single brand's numbers only mean something next to a baseline. Take Wingstop in the same Instagram set, across 594 posts. Wingstop gets unusual mileage from influencer collaborations: a 1.43x lift against a category norm of 0.97x for the same element. That edge is roughly 1.5 times what the category extracts from the move.
Wingstop also leaves a lever unused. The category earns a 1.08x lift from celebrity and influencer endorsement as a trust signal, while Wingstop pulls only 0.65x from it. It is the same element, with engagement the brand is not capturing. Reading a competitor this way shows the lever it owns and the lever it is fumbling, which tells you more than the number of ads it posts.
A single brand's numbers only mean something next to a baseline. Take Wingstop in the same Instagram set, across 594 posts. Wingstop gets unusual mileage from influencer collaborations: a 1.43x lift against a category norm of 0.97x for the same element. That edge is roughly 1.5 times what the category extracts from the move.
Wingstop also leaves a lever unused. The category earns a 1.08x lift from celebrity and influencer endorsement as a trust signal, while Wingstop pulls only 0.65x from it. It is the same element, with engagement the brand is not capturing. Reading a competitor this way shows the lever it owns and the lever it is fumbling, which tells you more than the number of ads it posts.
A repeatable competitor ad audit workflow
A repeatable competitor ad audit workflow
You can run this on any competitor in a few minutes once the labels exist. Follow five steps.
Pull the competitor set on one platform, so comparisons stay consistent.
For each creative element, pull two columns: usage and isolated lift.
Sort the elements into levers, drags, and table stakes.
Compare each brand's lift on an element to the category norm to find owned edges and unclaimed gaps.
Turn the top two levers into test briefs for your next flight.
None of these steps involves taking a screenshot. The output is a decision about what to test, not a gallery of competitor ads.
You can run this on any competitor in a few minutes once the labels exist. Follow five steps.
Pull the competitor set on one platform, so comparisons stay consistent.
For each creative element, pull two columns: usage and isolated lift.
Sort the elements into levers, drags, and table stakes.
Compare each brand's lift on an element to the category norm to find owned edges and unclaimed gaps.
Turn the top two levers into test briefs for your next flight.
None of these steps involves taking a screenshot. The output is a decision about what to test, not a gallery of competitor ads.
Where the creative labels come from
Where the creative labels come from
The hard part is step two. Reading lift instead of usage alone means every ad needs consistent labels for hook, talent, format, tone, and offer, with engagement attached to each. Labeling 3,804 posts by hand is the screenshot grind this workflow is meant to avoid. The practical alternative is a tool that labels creative at the category level and reports usage and lift side by side, which is how the numbers in this article were produced.
The hard part is step two. Reading lift instead of usage alone means every ad needs consistent labels for hook, talent, format, tone, and offer, with engagement attached to each. Labeling 3,804 posts by hand is the screenshot grind this workflow is meant to avoid. The practical alternative is a tool that labels creative at the category level and reports usage and lift side by side, which is how the numbers in this article were produced.
Frequently asked questions about analyzing competitor ads
Frequently asked questions about analyzing competitor ads
How do I analyze a competitor's ads?
To analyze a competitor's ads, pull their creatives on a single platform and label each ad's elements. Measure two things per element: how often it appears (usage) and how much it lifts engagement on its own (lift). Sort the elements into underused levers, overused drags, and table stakes, then compare each brand against the category norm.
What is the best way to find competitor ads?
The most common starting point for finding competitor ads is the Meta Ad Library, which shows live ads for free. Its limit is manual effort and no labeling, so it tells you what is running but not which elements work. A creative-intelligence tool is the best way to find competitor ads with labels and the engagement read.
Why does creative matter more than targeting?
Creative matters more than targeting because Nielsen and NCSolutions found it drives about 49 percent of a campaign's sales lift, more than reach, targeting, and recency combined (MarketingCharts, 2024). Creative is the largest lever most teams underweight.
What should I measure when analyzing competitor ads?
When analyzing competitor ads, measure usage and lift for each element on one platform. Usage is how often the element appears. Lift is its isolated effect on engagement. The elements that are high lift and low usage are where to focus your own testing.
How often should I run a competitor's creative audit?
Run a competitor creative audit monthly for most categories, with a quick check whenever a rival launches something new. Keep the audit quick enough that you will repeat it.
Run the read on your own category
The category and brand numbers above came from a self-serve creative read in Adology, which labels a whole market's ads and reports usage against lift. Run a free competitive ad audit on your own competitors with code EXPLORE2026 at dash.adologyai.com/explorer.
How do I analyze a competitor's ads?
To analyze a competitor's ads, pull their creatives on a single platform and label each ad's elements. Measure two things per element: how often it appears (usage) and how much it lifts engagement on its own (lift). Sort the elements into underused levers, overused drags, and table stakes, then compare each brand against the category norm.
What is the best way to find competitor ads?
The most common starting point for finding competitor ads is the Meta Ad Library, which shows live ads for free. Its limit is manual effort and no labeling, so it tells you what is running but not which elements work. A creative-intelligence tool is the best way to find competitor ads with labels and the engagement read.
Why does creative matter more than targeting?
Creative matters more than targeting because Nielsen and NCSolutions found it drives about 49 percent of a campaign's sales lift, more than reach, targeting, and recency combined (MarketingCharts, 2024). Creative is the largest lever most teams underweight.
What should I measure when analyzing competitor ads?
When analyzing competitor ads, measure usage and lift for each element on one platform. Usage is how often the element appears. Lift is its isolated effect on engagement. The elements that are high lift and low usage are where to focus your own testing.
How often should I run a competitor's creative audit?
Run a competitor creative audit monthly for most categories, with a quick check whenever a rival launches something new. Keep the audit quick enough that you will repeat it.
Run the read on your own category
The category and brand numbers above came from a self-serve creative read in Adology, which labels a whole market's ads and reports usage against lift. Run a free competitive ad audit on your own competitors with code EXPLORE2026 at dash.adologyai.com/explorer.

How to Analyze What Social Listening Misses in Video Posts
How to Analyze What Social Listening Misses in Video Posts

How to Build a Competitive Creative Briefing Executives Will Actually Use
How to Build a Competitive Creative Briefing Executives Will Actually Use

Your Swipe File Is Dysfunctional. Let’s Fix It
Your Swipe File Is Dysfunctional. Let’s Fix It

Why Better Prompts Don’t Fix Generic Marketing Advice
Why Better Prompts Don’t Fix Generic Marketing Advice

How to Benchmark Competitor Creative Against Client Goals
How to Benchmark Competitor Creative Against Client Goals

What Are Hydration Brands Actually Selling?
What Are Hydration Brands Actually Selling?

Is It a Creative Pattern or a Standout Ad?
Is It a Creative Pattern or a Standout Ad?

How to Find Creative Whitespace in Competitor Ads
How to Find Creative Whitespace in Competitor Ads

How to Analyze Competitor Ads With an AI Assistant
How to Analyze Competitor Ads With an AI Assistant
Best Ad Intelligence Tools in 2026: An Honest Breakdown
Best Ad Intelligence Tools in 2026: An Honest Breakdown
The market
The market
is moving right now.
is moving right now.
Your competitors' intelligence is updating. Your next brief will either start from what's actually working in your category this week, or it won't.
Your competitors' intelligence is updating. Your next brief will either start from what's actually working in your category this week, or it won't.
Free signup
Free signup
Pay as you go
Pay as you go
Cancel whenever
Cancel whenever
ADOLOGY AI
ADOLOGY AI
Marketing intelligence that holds itself accountable. Watches your market continuously, ships intelligence into your workflows, grades itself on every call.
Marketing intelligence that holds itself accountable. Watches your market continuously, ships intelligence into your workflows, grades itself on every call.
ADOLOGY
© 2026 Adology. All rights reserved.
© 2026 Adology. All rights reserved.